PineScript 常见指标开发
成交量 Volume

//@version=5
indicator("Volume", "Zok-成交量")
// 初始化:定义两个颜色
var color GOLD_COLOR = #CCCC00ff
var color VIOLET_COLOR = #AA00FFff
// 两个颜色可以修改
color bullColorInput = input.color(GOLD_COLOR, "涨")
color bearColorInput = input.color(VIOLET_COLOR, "跌")
int levelsInput = input.int(10, "梯度等级, 控制颜色深浅", minval=1)
// 初始化
var float riseFallCnt = 0
// 计算上升/下降,将范围固定为:1到' i_levels '
riseFallCnt := math.max(1, math.min(levelsInput, riseFallCnt + math.sign(volume - nz(volume[1])))) // 通过减去钱一根k的成交量,判断,当前k更大返回 1,否则返回-1
// 透明度: 计数重新调整为80,将其反转并将透明度设置为<80,以便颜色仍然可见。
float transparency = 80 - math.abs(80 * riseFallCnt / levelsInput) // 绝对值
// 建立涨或跌颜色的正确透明度
color volumeColor = color.new(close > open ? bullColorInput : bearColorInput, transparency)
plot(volume, "Volume", volumeColor, 1, plot.style_columns) // plot.style_columns 样式类型: 成交量柱
MACD
MACD 快线、signal(慢线) 和 Histogram (柱BAR)
macd 是核心
signal 是辅助
histogram 是快速移动平均线和慢速移动平均线的差值。BAR柱状图是用绿柱和红烛来的收缩判断行情
- 当快慢线处于 0 轴上方并向右上方移动时, 一般表示行情处于多头行情
- 当快慢线处于 0 轴下方并向右下方移动时, 一般处于空头
- 当在 0 轴上方死叉向右下方移动,表示空头行情,价格将出现下跌
- 当在 0 轴下方金叉向右上方移动,表示多头将启动
//@version=5
indicator("MACD #1")  // 指标
fast = 12
slow = 26
fastMA = ta.ema(close, fast)
slowMA = ta.ema(close, slow)
macd = fastMA - slowMA
signal = ta.ema(macd, 9)
plot(macd, color = color.blue)
plot(signal, color = color.blue)
//@version=5
indicator(title="MACD #2")
fastInput = input.int(12, "快线")
slowInput = input.int(26, "慢线")
[macdLine, signalLine, histLine] = ta.macd(close, fastInput, slowInput, 9) // 直接调用原生函数计算 macd
plot(macdLine, color = color.blue)
plot(signalLine, color = color.yellow)SMA 均线
简单移动平均线 simple moving average, SMA
10 日均线就是 最近10天的价格加起来/10
// This source code is subject to the terms of the Mozilla Public License 2.0 at https://mozilla.org/MPL/2.0/
// © rum7126

//@version=5
indicator("我的脚本", (overlay = true));

// technical analysis 技术分析库
ma20 = ta.sma(close, 20); // simple moving average : 简单 ma 均线
plot(ma20, (color = color.red), (linewidth = 2)); // 加粗 + 变色
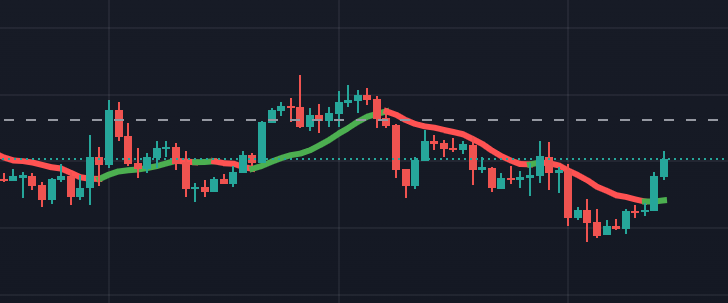
变色均线
当前均线值 > 上一个均线, 改变颜色
// This source code is subject to the terms of the Mozilla Public License 2.0 at https://mozilla.org/MPL/2.0/
// © rum7126

//@version=5
indicator("我的脚本", overlay=true)

// technical analysis 技术分析库

ma14 = ta.sma(close, 14)

_color = if ma14 > ma14[1]  // 当前均线值 > 上一个均线 ma14[1]
    color.green
else
    color.red

plot(ma14, color=_color, linewidth=3)
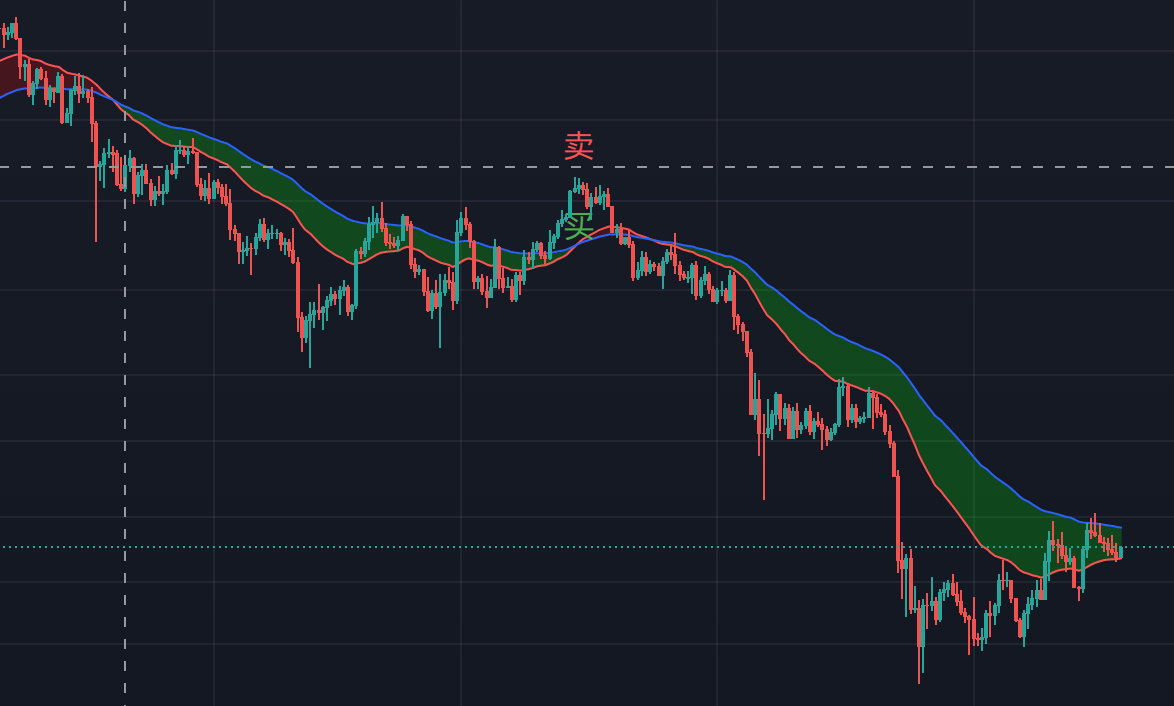
均线填充
给 ema 区块进行颜色填充
// This source code is subject to the terms of the Mozilla Public License 2.0 at https://mozilla.org/MPL/2.0/
// © rum7126

//@version=5
indicator("金叉死叉均线区域填充", overlay=true)

// technical analysis 技术分析库

// 取均线
maA = ta.ema(close, 32)
maB = ta.ema(close, 64)
// 画均线
line1 = plot(maA, color=color.red)
line2 = plot(maB, color=color.blue)
// 获取金叉死叉
gold = ta.crossover(maA, maB)  // 金叉
dead = ta.crossunder(maA, maB)  // 死叉
// 金叉死叉信号绘制
plotchar(gold, char="买", location=location.belowbar, color=color.green, size=size.tiny) //  location: 位置上方
plotchar(gold, char="卖", location=location.abovebar, color=color.red, size=size.tiny)
// 填充背景 fill 填充
_color = maA>maB ? color.new(#ff0000, 80) : color.new(#00ff00, 80) // 三元运算,颜色变化, 80 的透明度
fill(line1, line2, color=_color)
RSI 趋势强弱
计算 N 日内收盘涨幅平均值和跌幅平均值
0 < RSI < 100 , RIS = 50 时强弱分界点
RSI < 30 超卖
RSI > 70 超买
//@version=5
indicator("RSI")
plot(ta.rsi(close,7))
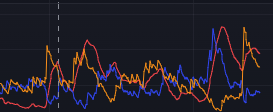
DMI 动向指标、趋势指标
[diplus, diminus, adx] = ta.dmi(len, lensig)

diplus = 上升动向
diminus = 下降动向
diplus 统计多方力量强弱, diminux相反
ADX 曲线统计的是 diplus 和 diminus 两条曲线之间的差距。 只要 diplus 和 diminus 两条曲线之间距离拉大,无论哪条在上方, ADX曲线都会快速上涨
//@version=5
indicator(title="DMI", format = format.price, precision = 4)
len = input.int(17, minval=1, title = "DI Length")
lensig = input.int(14, title="ADX Smoothing", minval=1, maxval=50)
[diplus, diminus, adx] = ta.dmi(len, lensig) // 给到 3 个变量
plot(adx, color=color.red, title='ADX')
plot(diplus, color=color.blue, title="+DI")
plot(diminus, color=color.orange, title="-DI")本博客所有文章除特别声明外,均采用 CC BY-SA 4.0 协议 ,转载请注明出处!