PineScript 运算与功能
运算
算数
addition=1+1
substraction=10-5
multiply= = 2 * 5
division = 12 / 2
modulo = 10 % 5     //余数, 10除以5,余数为0
string="EUR" + "USD"    // 加号可以将文本连接在一起, “EURUSD”
floatConversion = 1 * 1.5     // 当整数乘以小数的时候,结果为小数
naValue = 10 * 3 + na        //任何运算中涉及到了na, 则结果为na

math.abs(-5)=5    //绝对值
math.round(1.45, 0) = 1      //四舍五入

counter += 1      // 相当于 counter = count + 1, 每次运行变量的值都增加1
比较运算
lessThan = close < close [1]         //当前最低值低于前一根蜡烛图最低值, 同样的也可以用 >, >=, <=
notEqual = close != open [1]         //当前蜡烛图收盘值 不等于 前一根蜡烛图收盘值
equal= close == open         //开盘价等于收盘价, == 也可以用于判断文本是否一样 "X" == "Y"
逻辑运算
bar= close <= open [1] and close [1] > open [1] //类似的逻辑判断符号有 and, or, not条件运算
ema = ta.ema ( close, 50 )         // ta.eam 实值提取50日移动平均线的值,根据收盘价计算
col = color.white

if close > ema
    col := color.green         //当给变量初次赋值时使用 = , 之后每一次赋值都用 :=
else
    col := color.red           //如果收盘价大于移动平均值,颜色为绿色,否则为红色


col = close > ema ? color.green : color.red       //这是更精简的写法,如果条件成立,颜色为绿色,否则为红色
col = close > ema > color.green: close > open ? color.purple :  color.red      //条件运算可以嵌套
循环
//计算过去10个时间周期,上涨的次数

lookback = input.int(9)                    //允许用户自定义计算周期
var greenCandle = 0
for i=0 to lookback by 1                   //下方缩进部分的程序循环运算10次,i的值将从0增长到9,每次增加1,如果省略by 1,默认每次增加1
    greenCandles := greenCandles + (close[i] > open [i] ? 1 : 0 )          //当收盘价大于开盘价则加1,否则加0


//通过条件中断循环
for i=0 to lookback
    if close[i] < open[i]
        continue                           //当收盘价小于开盘价,continue之后的循环部分被跳过,直接进入下一次循环
    if close [i] > high [i+1]              //当收盘价高于前一个最高价,完全跳出整个 for 循环
        break
greenCandles := greenCandles + 1var counter = 0
var redBars = 0
while counter <10
counter += 1 //每次运算加1,相当于 counter = counter + 1
if close[counter] > open[counter] //如果收盘价高于开盘价,则跳出当前循环,进入下一次循环
continue
redBars += 1 //如果收盘价低于开盘价,则redBars的值加一Switch
// 允许用户选择移动平均线(MA)的类型和计算长度
maType = input.string(title="MA Type", defval="EMA", options=["EMA", "SMA", "RMA", "WMA", "Random Input"])
maLength = input.int(title="MA Length", defval=50, minval=1)

// 根据用户的选择确定移动平均线类型
movingAverage = switch maType
    "EMA" => ta.ema(close, maLength)
    "SMA" => ta.sma(close, maLength)
    "RMA" => ta.rma(close, maLength)
    "WMA" => ta.wma(close, maLength)
    =>                                                        //当上面的条件都不满足时,就会执行=>符号后的信息
        runtime.error("No matching MA type found!")
        na

// 绘图
plot(movingAverage)

// 通过是否判断编写更简洁的Switch语句
hc = close > high[1]                     //如果收盘价大于前一个蜡烛图的最高价,则hc等于True
lc = close < low[1]

switch
    hc => alert("Higher close detected!", alert.freq_once_per_bar_close)     //如果hc等于True, 则触发报警
    lc => alert("Lower close detected!", alert.freq_once_per_bar_close)
注意:switch返回的数据类型必须属于同一类型,比如都是文本或数字
形态
吞没形态

//@version=5
indicator("test", overlay=true)
hc = close > high[1]   //如果当前蜡烛图收盘价大于前一根蜡烛图的收盘价,则为True
lc = close < low[1]

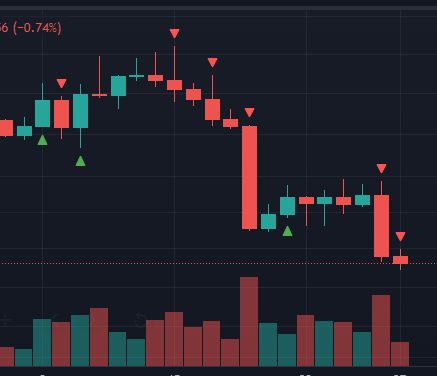
plotshape(hc,style=shape.triangleup, location=location.belowbar, color=color.green )
plotshape(lc,style=shape.triangledown, location=location.abovebar, color=color.red )
吞噬

//@version=5
indicator("test", overlay=true)
bull_ec = close[1] < open[1] and open <= close[1] and close >= open[1]
bear_ec = close[1] > open[1] and open >= close[1] and close <= open[1]

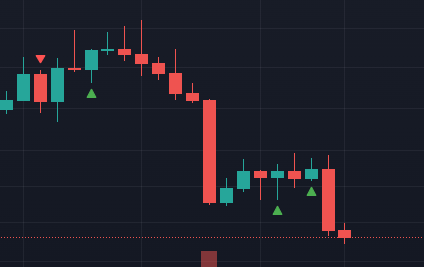
plotshape( bull_ec, style=shape.triangleup, location=location.belowbar, color=color.green, title="Bullish EC")
plotshape( bear_ec, style=shape.triangledown, location=location.abovebar, color=color.red, title="Bear EC")
分型吞噬

//@version=5
indicator("test", overlay=true)
//判断当前和前一根蜡烛图是否是过去10根蜡烛图的最高点或最低点
swingHigh = high == ta.highest(high,10) or high[1] == ta.highest(high, 10)
swingLow = low == ta.lowest(low, 10) or low[1] == ta.lowest(low,10)

// 用50移动平均线,进一步优化,在均线上只看多,均线下只看空
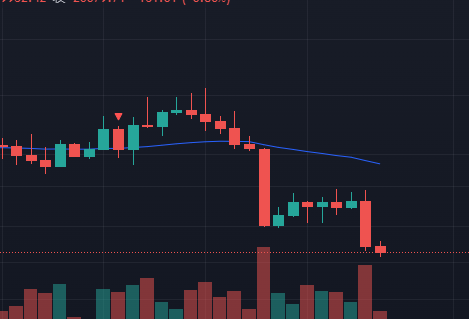
ema = ta.ema(close, 50)
plot(ema)

bull_ec = close[1] < open[1] and open <= close[1] and close >= open[1] and swingLow and close > ema
bear_ec = close[1] > open[1] and open >= close[1] and close <= open[1] and swingHigh and close < ema

plotshape( bull_ec, style=shape.triangleup, location=location.belowbar, color=color.green, title="Bullish EC")
plotshape( bear_ec, style=shape.triangledown, location=location.abovebar, color=color.red, title="Bear EC")
容错率调整

//@version=5
indicator("test", overlay=true)

// 设置用户输入的允许误差值
pointAllowance = input.int(title="Point Allowance", defval=0, tooltip="Maximum gap allowed in points on engulfing candles")

// 检测当前蜡烛图值是否是过去10个时间周期的极值(最高或最低)
swingHigh = high == ta.highest(high, 10) or high[1] == ta.highest(high, 10)
swingLow  = low == ta.lowest(low, 10) or low[1] == ta.lowest(low, 10)

//检测符合条件的蜡烛图并允许一定误差范围,syminfo.minitick 可以获得当前交易价格在小数点后有几位
var allowance = syminfo.mintick * pointAllowance
bull_ec = close[1] < open[1] and open <= (close[1] + allowance) and close >= (open[1] + allowance) and swingLow
bear_ec = close[1] > open[1] and open >= (close[1] - allowance) and close <= (open[1] - allowance) and swingHigh

// 绘制图表
plotshape(bull_ec, style=shape.triangleup, location=location.belowbar, color=color.green, title="Bullish EC")
plotshape(bear_ec, style=shape.triangledown, location=location.abovebar, color=color.red, title="Bearish EC")
Lib 库调用

// This source code is subject to the terms of the Mozilla Public License 2.0 at https://mozilla.org/MPL/2.0/
// © ZenAndTheArtOfTrading / www.PineScriptMastery.com
// @version=5
indicator("Zen Library Patterns", overlay=true)

// 调用zen库
import ZenAndTheArtOfTrading/ZenLibrary/2 as zen             //为方便引用,将调用库的名字缩写成zen

// 调用代码判断蜡烛图形态: 吞噬,锤子,十字星
bullish_ec  = zen.isBullishEC()
bearish_ec  = zen.isBearishEC()
hammer      = zen.isHammer()
star        = zen.isStar()
doji        = zen.isDoji()

// 绘制形态判断
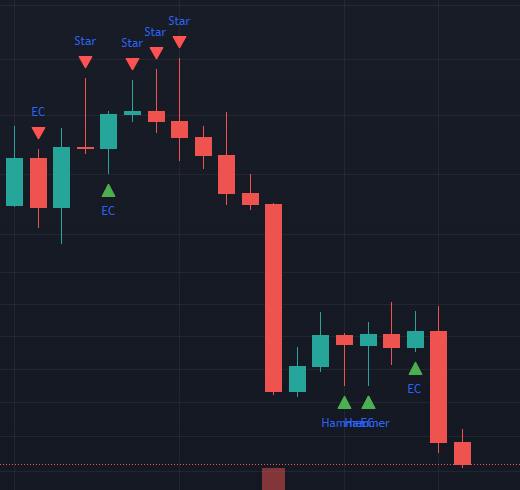
plotshape(bullish_ec, style=shape.triangleup, color=color.green, location=location.belowbar, text="EC")
plotshape(bearish_ec, style=shape.triangledown, color=color.red, location=location.abovebar, text="EC")
plotshape(hammer, style=shape.triangleup, color=color.green, location=location.belowbar, text="Hammer")
plotshape(star, style=shape.triangledown, color=color.red, location=location.abovebar, text="Star")
plotshape(doji, style=shape.xcross, color=color.blue, location=location.abovebar, text="Doji")
定义函数
//只有一行代码的自定义函数
addition(x, y) => x + y              // 等于号+大于号是自定义函数的特征
addition(1,2)

//多行自定义函数
multiplier = 2
mult (x, y) =>                       // => 是自定义函数的特征
    value = x * y                    //当自定义函数需要多行时,需要缩进(Tab或者4个空格)
    value * multiplier               //需要特别注意,value是在自定义函数内出现的变量,无法在自定义函数外使用

//多结果自定义函数
multiResult (x, y) =>
    a = x + y
    b = x - y
    [a, b]                           //当需要返回多个结果时,可以用方括号括起来
[r1, r2] = multiResult (1, 2)        //在引用多结果时,也需要用双括号
最大&最小值
// @version=5
indicator("Test", overlay=true)
highestOpen=ta.highest(open, 50)        //获取过去50根K线的最高开盘价
breakout=close>high[1]                  //判断当前K线收盘价是否大于之前的最高价,大于就是突破
plot(highestOpen, color=color.blue)     //绘制出过去50根K线的动态最高价
bgcolor(breakout ? color.green : na )   //当前收盘价如果高于过去50个K线的最高价,则背景颜色变成绿色

//我们也可以灵活一些,比如用同样的方法判断RSI的突破
rsi=ta.rsi(close, 14)
highestRSI=ta.highest(rsi, 50)
lowestRSI=ta.lowest(rsi,50)
plot(highestRSI, color=color.blue) 本博客所有文章除特别声明外,均采用 CC BY-SA 4.0 协议 ,转载请注明出处!